
Finding the right tools to check on investment portfolios can be tough.
Many advisors use portfolio visualizer tools to help with this. This blog covers the best tools for managing and analyzing investments.
Key Features to Look for in Portfolio Visualizer Tools
Portfolio visualizer tools should offer asset allocation analysis, risk assessment and performance metrics, customizable reporting, integration with financial accounts, and backtesting and forecasting capabilities.
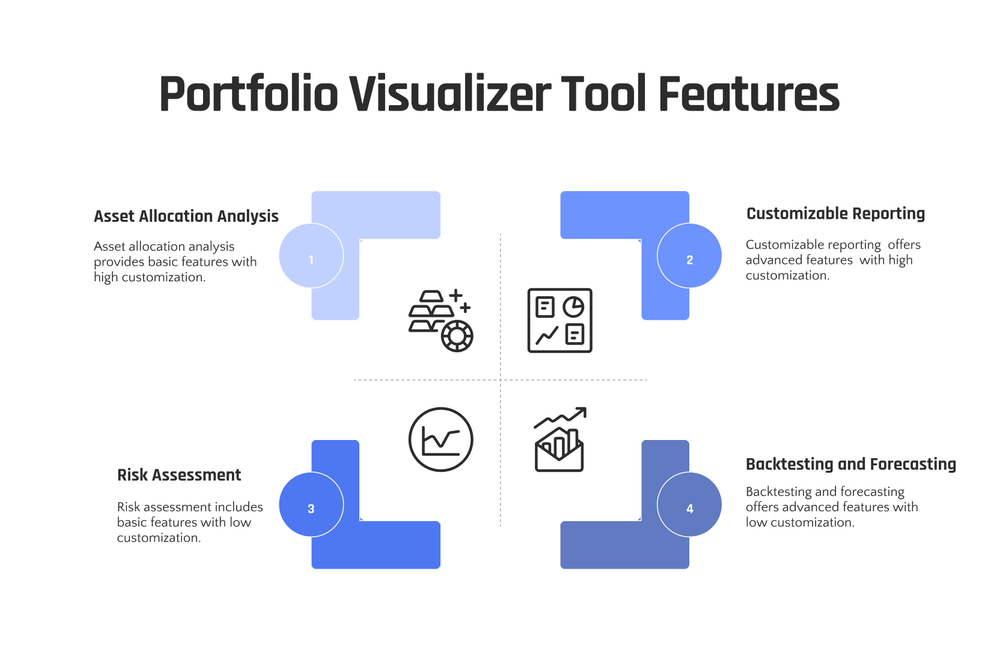
These features help advisors make informed investment decisions and improve portfolio performance.
Asset Allocation Analysis
These tools help advisors analyze how to distribute investments across various asset types, which supports diversification of the investment portfolio. Advisors can match their clients' risk tolerance and financial objectives with a suitable combination of stocks, bonds, cash, and precious metals.
To propose a target asset allocation, these tools use past data and current market patterns. They account for risk evaluation, portfolio performance, and currency volatility.
The result is a clear view of how each type of asset could affect the total investment strategy and returns.
Risk Assessment and Performance Metrics
Beyond asset allocation analysis, portfolio visualizer tools must also cover risk assessment and performance metrics. These features help advisors see how risky an investment is and how well it performs over time.
They use numbers like the Sharpe ratio to measure risk against return. This helps in comparing different investments quickly. Also, tools track past performance and estimate future returns using historical data.
These metrics let advisors make better decisions by looking at potential capital gains or losses. They consider factors like market volatility, currency fluctuations, and interest payments.
By studying these details, financial advisors can judge which investments might do well and which ones could be too risky for their clients' portfolios.
Customizable Reporting
Once risk and performance are understood, advisors can use customizable reporting to create clear investment reports. This lets them show clients the status of their investments in plain terms.
They can choose what to include, such as asset distribution or portfolio yields, so each report addresses what a particular client actually cares about.
Customizable reporting also helps with monitoring progress against financial objectives. Advisors can modify reports as required and call out the numbers that matter, like cash inflow or projected capital gains.
That makes it easier for clients to understand their investments and the decisions behind them.
Integration with Financial Accounts
Beyond customizable reporting, direct connections between portfolio visualizer tools and financial accounts matter a great deal. Syncing with investment accounts, brokerage accounts, retirement accounts, and bank accounts allows for more accurate portfolio tracking and analysis.
By pulling in multiple portfolios and mapping them against investment goals, these tools give a full view of asset correlations, sector weightings, cash flow, and historical performance.
Backtesting and Forecasting Capabilities
Portfolio visualizer tools with historical testing and projecting capabilities help advisors make informed investment decisions. These tools let users assess how a portfolio would have performed under different historical scenarios, which reveals a lot about potential risks and returns.
Using algorithms and historical data, backtesting features let advisors simulate how their portfolios would have performed in the past, which is a practical check on the strength of an investment strategy.
Projecting capabilities use analytical models to estimate future portfolio performance under different market conditions, so advisors can make proactive adjustments to their clients' investments for the long term.
When evaluating these tools, advisors should prioritize those that offer reliable historical testing and projecting features alongside customizable reporting options.
Direct integration with financial accounts also keeps the data inputs accurate, which makes the analysis and the resulting decisions more trustworthy. With these capabilities, advisors are better equipped to guide their clients toward their investment goals while managing risk.
Empower
Empower provides asset allocation analysis, risk assessment, and customizable reporting to help advisors make informed investment decisions. It connects with financial accounts and offers solid backtesting and forecasting capabilities for portfolio management.
Features & Description (Empower)
Empower offers asset allocation analysis, risk assessment tools, and customizable reporting to help advisors make informed investment decisions. It connects with financial accounts, giving easy access to the information you need for portfolio management.
Backtesting and forecasting capabilities show how a portfolio might perform based on historical data. With these features, Empower gives advisors a full toolkit for portfolio visualization and analysis.
The platform's straightforward interface simplifies investment tracking and performance evaluation. Analytical tools such as factor analysis and Monte Carlo simulations let advisors evaluate portfolio risk thoroughly and align investments with their clients' financial goals.
It also provides detailed reports on asset classes, mutual funds, stocks, and hedge funds to support decision-making. Overall, Empower is built to strengthen the advisor-client relationship with portfolio management tools that hold up as markets change.
Pros & Cons (Empower)
Examining the advantages and disadvantages of using Empower as a portfolio visualizer tool offers insight for advisors. Here's a detailed breakdown:
| Pros | Cons |
|---|---|
| Empower provides comprehensive asset allocation analysis. | Limited customization options for reports. |
| Features detailed risk assessment and performance metrics. | Some users find the interface challenging to navigate. |
| Offers integration with various financial accounts for streamlined management. | Backtesting capabilities might not meet the needs of all advisors. |
| Supports forecasting to help predict future portfolio performance. | Higher cost compared to some other tools available on the market. |
Empower does well on asset analysis and risk assessment but could improve in areas like report customization and user interface.
Morningstar Portfolio Manager Instant X-Ray
Morningstar Portfolio Manager Instant X-Ray gives a detailed look at the makeup of your investment portfolio, from asset allocation to individual security analysis. It lets advisors quickly evaluate the risk and performance metrics of their clients' portfolios without much friction.
Features & Description (Morningstar Portfolio Manager Instant X-Ray)
Morningstar Portfolio Manager Instant X-Ray gives a detailed view of your investment portfolio. It shows the asset allocation, sector diversification, and stock style breakdown of your holdings.
It also lets you evaluate the geographic exposure of your investments and see how different regions contribute to your overall portfolio.
The tool assesses the risk within your portfolio by analyzing metrics such as volatility, beta, and standard deviation. With these performance measurements in hand, users can make investment decisions based on concrete data rather than guesswork.
It also gives investors an instant analysis of potential risks in their portfolios, which is a useful check before making any big moves.
Pros & Cons (Morningstar Portfolio Manager Instant X-Ray)
Exploring the Morningstar Portfolio Manager Instant X-Ray reveals its strengths and weaknesses. Here's a quick rundown in table format:
| Pros | Cons |
|---|---|
| Offers detailed asset allocation analysis. | Lacks real-time data updates. |
| Includes risk assessment and performance metrics. | Some features require a premium subscription. |
| Provides customizable reporting options. | Can be complex for beginners. |
| Allows easy visualization of investments. | Integration with financial accounts is limited. |
Next, we'll review the Portfolio Visualizer tool.
Portfolio Visualizer
Portfolio Visualizer offers a broad set of tools for portfolio analysis and tracking. Its straightforward interface and range of features make it a top choice for advisors who want serious portfolio management capability.
Features & Description (Portfolio Visualizer)
Portfolio Visualizer is a strong resource for evaluating investment portfolios. It supports thorough analysis of asset allocation, so users can see how their investments spread across assets such as stocks, bonds, and other securities.
The platform also provides solid risk appraisal and performance metrics, letting users gauge overall risk exposure and assess historical performance across various financial measures.
Portfolio Visualizer offers customizable reporting as well, with tailored views of portfolio diversification and investment performance.
The tool includes backtesting and forecasting capabilities that let users model investment strategies under varying market conditions, and it can streamline data collection and analysis.
For investors who want thorough portfolio analysis with a focus on asset allocation and risk management, Portfolio Visualizer covers a lot of ground.
Pros & Cons (Portfolio Visualizer)
After exploring the features of Portfolio Visualizer, weigh its advantages and drawbacks. This helps users decide whether this tool fits their investment strategy needs.
| Pros | Cons |
|---|---|
| Offers comprehensive backtesting capabilities. | Limited customer service options. |
| Free to use for basic features. | Advanced features require a subscription. |
| Supports asset allocation analysis. | Interface can be complex for beginners. |
| Includes risk assessment and performance metrics. | Does not integrate directly with financial accounts. |
| Provides a wide range of financial modeling tools. | Forecasting capabilities might seem overwhelming initially. |
| Allows for easy customization of reporting. | May require a learning curve to utilize all features effectively. |
This table outlines the key pros and cons of Portfolio Visualizer, offering a snapshot of what users can expect.
Stock Rover
Stock Rover offers a clean interface and deep analysis tools, making it a top choice for advisors who want detailed portfolio visualizations. Its features include advanced stock screening, charting, and research reports that give advisors real material for decision-making.
Features & Description (Stock Rover)
Stock Rover is a capable portfolio management and analysis tool with a wide range of features to help advisors make well-informed investment decisions. With Stock Rover, users can monitor stocks, analyze portfolio returns, assess risk with maximum drawdown metrics, and evaluate estimated capital gains.
The platform offers personalized reporting and connects with financial accounts so everything stays in one place.
Stock Rover's backtesting and forecasting capabilities use historical data to inform future investment strategies, which is especially useful when markets get choppy.
The software also includes asset allocation analysis tools to customize portfolios for specific investment objectives. Stock Rover also provides a budgeting tool and retirement planner to help users plan for their financial future.
Pros & Cons (Stock Rover)
With the features covered, here are Stock Rover's strengths and weaknesses. Stock Rover provides comprehensive screening tools to identify potential investments with strong financials, performance metrics, and dividend history. It also offers detailed research reports for thorough analysis.
Stock Rover does well on usability, dynamic charting capabilities, and integration with brokerage accounts for easy portfolio tracking. Users can also access pre-built screeners or create custom ones according to their specific investment criteria.
Stock Rover's long feature list may pose a challenge for beginners. Some users might also find the pricing slightly higher compared to other portfolio visualizer tools on the market.
In short, Stock Rover has excellent research resources but may not suit those who want something simpler or cheaper.
Vyzer
Vyzer provides customizable reporting and connects with financial accounts for straightforward portfolio visualization. Its backtesting and forecasting capabilities give advisors real data to base investment decisions on.
Features & Description (Vyzer)
Vyzer is a portfolio visualizer tool built to simplify the investment management process. It offers in-depth asset allocation analysis, with real-time views of portfolio diversification and risk exposure.
Vyzer's risk assessment tools and performance metrics let users make decisions based on historical and projected data, which supports better portfolio performance.
The customizable reporting feature lets advisors tailor reports to their clients' needs, which improves transparency and communication. Integration with financial accounts simplifies data aggregation and puts all investments in one view.
Vyzer's backtesting and forecasting capabilities also let advisors test different investment strategies and make data-driven forecasts for future performance. With Vyzer, advisors can track stocks, adjust asset allocation, and maximize tax benefits for their clients' portfolios.
Pros & Cons (Vyzer)
Vyzer provides extensive asset allocation analysis and risk assessment, which supports well-informed investment decisions. The customizable reporting feature allows tailored insights for each client's portfolio. Although the platform lacks backtesting capabilities compared to its competitors, it does offer a clean interface and solid forecasting tools. It could improve, though, in integrating with external financial platforms.
On risk assessment and performance metrics, Vyzer falls short of tools like Portfolio Visualizer and Empower because of its limited backtesting features. Still, its interface and forecasting capabilities make it an attractive option for advisors who want efficient portfolio management without extra complexity.
Kubera
Kubera offers full-featured investment portfolio tracking and analysis. With customizable reporting and advanced forecasting capabilities, Kubera gives advisors what they need to make informed decisions for their clients' portfolios.
Features & Description (Kubera)
Kubera presents easy-to-use portfolio management tools to track and manage investments. With asset allocation analysis, risk assessment, customizable reporting, and integration with financial accounts, Kubera covers the full picture of investment monitoring.
It also offers backtesting and forecasting capabilities that let users evaluate potential investment scenarios. Through its intuitive interface, users can see clearly how their investments are performing.
Kubera also stands out for its security measures, including bank-level encryption and two-factor authentication that protect sensitive financial information. The platform's design makes it suitable for both novice investors and seasoned professionals who want one tool to manage their portfolios.
With Kubera's user base spanning various countries since its inception in 2019, it has become a reliable choice for individuals seeking dependable investment tracking.
Pros & Cons (Kubera)
With the features covered, here are Kubera's pros and cons. Kubera offers a full platform to manage your entire financial life. On the positive side, it provides a consolidated view of all your accounts, including bank, investments, property, and liabilities. This gives you a complete picture of your net worth and financial health at any given time. Kubera also stores data securely with encryption technology, which matters when you're protecting sensitive financial information against cyber threats.
One drawback: while Kubera integrates with major financial institutions' accounts such as banks and investment firms, it may not cover all smaller or regional institutions. Users with accounts at such establishments might not get a complete overview.
How to Maximize the Benefits of Portfolio Visualizer Tools
Get the most from these tools by rebalancing your portfolio consistently and matching the tools to your investment goals. That keeps your investments aligned with your overall financial strategy and grounds your decisions in your actual goals.
Regular Portfolio Rebalancing
Regular portfolio rebalancing involves periodically adjusting investment holdings to maintain the desired asset allocation. This process helps manage risk and keeps the investment strategy on course over time, so the portfolio stays aligned with long-term financial goals.
By rebalancing regularly, one can capitalize on market fluctuations and keep the portfolio in line with risk tolerance and objectives.
Regular portfolio rebalancing is a standard discipline for managing risk while pursuing returns. Review and rebalance the portfolio at least annually or when there are significant deviations from the target asset allocation.
This disciplined approach lets investors make decisions grounded in their financial planning tools and keep the portfolio balanced around their specific needs.
Aligning Tools with Investment Goals
To get the most from portfolio visualizer tools, match them to your investment goals. That means setting clear objectives for your investments, whether it's long-term growth, income generation, or capital preservation.
Once you know your goals, you can choose tools that offer the features and analysis to support those specific aims. For instance, if your goal is long-term growth, look for portfolio visualizer tools with solid backtesting and forecasting capabilities to assess how different investment scenarios may affect future results.
If income generation is the priority instead, seek out tools that offer customizable reporting for tracking dividend yields and income distributions within your portfolios.
How these portfolio visualizer tools connect with financial accounts also matters when matching them to investment goals. Tools that integrate with various financial accounts provide a full view of all assets and liabilities, which you need for informed decisions when managing an investment portfolio.
The point is to select tools that help you achieve whatever you've set as your investment goal, whether that's growing wealth over time or generating regular income while preserving capital.
The right match lets investors make decisions grounded in their own financial objectives.
Next up: Conclusion
Conclusion
For advisors, the right portfolio visualization tool matters. These tools give advisors real insight into asset allocation, risk assessment, and performance metrics.
From Empower to Stock Rover, these tools help advisors get the most out of their clients' investments. By working these tools into your process and matching them to specific investment goals, you keep portfolios positioned the way you intend.
FAQs
1. What are the best portfolio management software for advisors?
The best portfolio management software for advisors includes tools like Personal Capital, Quicken Premier, and Investment Account Manager. These offer top portfolio analysis tools and investment management reports.
2. Are there any free options available in portfolio analyzer software?
Yes. Many Portfolio Analysis Tools provide a free investment checkup tool or a free portfolio tracker which can be used to manage your stock portfolio effectively.
3. What is the benefit of using the best portfolio analyzer software?
Using the best portfolio analyzer software helps with easy tracking of investments, analyzing current prices, and calculating internal rates to help make informed decisions about minimum initial investments.
4. Is it necessary to have a professional plan for these tools?
While some services may require a professional plan, many others offer basic features like instant X-ray views of your investments without needing an upgrade.
5. How does Portfolio Management Software help advisors?
Portfolio Management Software helps create detailed investment management reports by analyzing factors such as stock performance and market trends, which gives advisors better material for their advice.