
Facing trouble understanding market trends? The Directional Movement Index (DMI) Indicator is a powerful tool in technical analysis. This blog will show how DMI helps spot trend direction and strength.
Keep reading to learn more!
Key Takeaways
-
The DMI indicator helps traders know if an asset is moving up or down and how strong the movement is. It uses +DI for upward trends, -DI for downward trends, and ADX to measure trend strength.
-
To figure out DMI values, you use formulas that compare current price movements with previous ones. These calculations show whether buying or selling based on trend direction might be a good idea.
-
The ADX part of DMI tells you how strong a trend is without caring if it's going up or down. A high ADX number means a very strong trend.
-
Using DMI can make spotting entry and exit points in trading easier because it reduces false signals that other tools might give.
-
However, DMI isn't perfect and might not work as well when there's no clear market trend. Plus, it can be slow in giving buy or sell signals since it follows price moves that have already happened.
What Is the Directional Movement Index (DMI) Indicator?
Moving on from the introduction, let's explore the Directional Movement Index (DMI) Indicator. The DMI is a tool used in technical analysis to find out if an asset is moving up or down and how strong the trend is.
This indicator combines two lines: the Positive Directional Indicator (+DI) and Negative Directional Indicator (-DI). Together with the Average Directional Index (ADX), these elements show both direction and strength of price movements.
The DMI helps traders spot trends and their potential strength for better trading decisions.
Traders use this information to choose when to buy or sell. The ADX value, part of the DMI, measures how strong a trend is. A high ADX value means a strong trend, whether it's up or down.
This makes the DMI valuable for spotting profitable entry and exit points in financial markets.
Components of the DMI Indicator
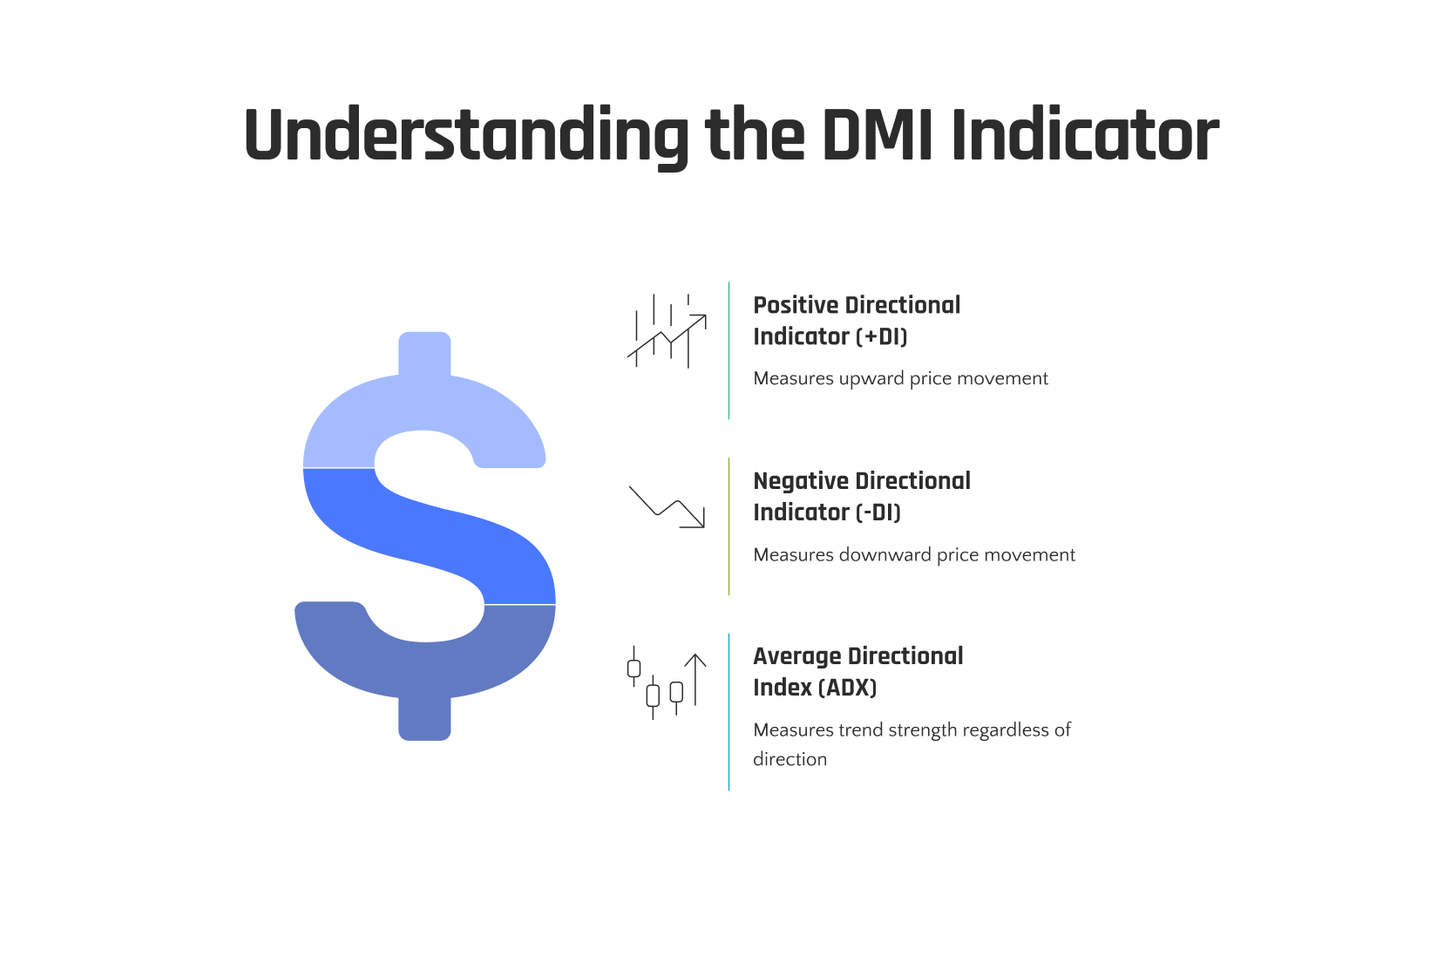
The DMI Indicator consists of three key components: the Positive Directional Indicator (+DI), Negative Directional Indicator (-DI), and Average Directional Index (ADX). These components play vital roles in analyzing asset price trends.
Positive Directional Indicator (+DI)
The Positive Directional Indicator, or +DI, measures upward price movement. It shows how strong the upward trend is in an asset's price. To find it, traders compare the difference between two highs.
They look at the current high and the previous high. If today's high is higher than yesterday's, this suggests a strong positive trend.
+DI helps in spotting bullish trends in the market. A rising +DI line means upward pressure on prices is growing stronger. This guides traders to see if they should consider buying.
It works best alongside other indicators like ADX to confirm signals and reduce false alarms about entering trades too soon or wrongly predicting trends.
Negative Directional Indicator (-DI)
After exploring the Positive Directional Indicator (+DI), it's natural to look at its counterpart, the Negative Directional Indicator (-DI). This part of the DMI focuses on downward price movement.
It measures the strength of a downtrend in an asset's price. The -DI increases when prices are moving downward and decreases during upward trends. Traders watch this indicator closely to spot potential sell signals or bearish trends.
The -DI helps identify strong bearish movements, guiding traders toward possible short positions.
With each session that sees a lower low than the previous one, the -DI value might rise, indicating stronger negative directional movement. Its calculation involves looking at periods where the current low minus the previous low is greater than other calculations involving price ranges and true range.
This focus makes -DI essential for those analyzing markets for selling opportunities or predicting trend reversals into bearish territories.
Average Directional Index (ADX)
The Average Directional Index (ADX) is a technical analysis tool used to measure the strength of a trend. It's part of the Directional Movement Indicator (DMI). ADX ranges from 0 to 100, with values above 25 generally indicating that a stock is trending strongly.
Traders typically look for ADX values above 25 to confirm the presence of a strong trend. The indicator does not differentiate between upward or downward trends and solely measures the strength of the trend.
Traders use ADX to identify if there's a strong trend, regardless of its direction. For example, an ADX reading above 25 signals that there's substantial directional movement in either an uptrend or downtrend.
This aids traders in making decisions about whether it’s more feasible to enter into or exit trades based on current market conditions and asset price movements. In summary, ADX is highly valued as it assesses only the strength of trends without considering their direction.
How to Calculate the DMI Indicator
To calculate the DMI indicator, you need to use specific formulas for its components. It's crucial to understand these calculations for effective use of this technical analysis tool.
Read more about it in our blog!
Formulas for DMI Components
-
Positive Directional Indicator (+DI):
-
+DI = Current High - Previous High (Upward Movement) if it exceeds Previous Low - Current Low (Downward Movement), and the outcome is positive.
-
+DI = 0 if the upward movement is less than or equal to the downward movement.
-
-
Negative Directional Indicator (-DI):
-
-DI = Previous Low - Current Low (Downward Movement) if it exceeds Current High - Previous High (Upward Movement), and the outcome is positive.
-
-DI = 0 if the downward movement is less than or equal to the upward movement.
-
-
Average Directional Index (ADX):
-
+DM14 and -DM14 are smoothed over 14 periods using Wilder's Smoothing Method.
-
+DI14 and -DI14 are then divided by ADX, providing two directional movement indicators.
-
Please bear in mind that these formulas assist in calculating the DMI components vital for interpreting market trends and making informed trading decisions.
How to Interpret the DMI Indicator
To interpret the DMI indicator, identify the trend direction and measure its strength. This helps in making informed trading decisions based on market trends.
Identifying Trend Direction
The Directional Movement Index (DMI) Indicator helps in identifying the direction of a trend. By using the +DI and -DI lines, traders can determine if an asset is in an uptrend or downtrend.
When +DI line crosses above -DI line, it indicates a potential uptrend, while when -DI line crosses above +DI line, it signals a possible downtrend. This allows traders to make informed decisions about whether to enter a long trade in bullish markets or a short trade in bearish markets based on the trend direction indicated by the DMI indicator.
In summary, when analyzing trend direction with the DMI indicator, traders watch for crossovers between the +DI and -DI lines to understand whether an asset is likely moving upward or downward.
This identification is crucial for creating effective trading strategies that align with market trends and avoiding potential false signals.
Measuring Trend Strength
Measuring trend strength is crucial for understanding the power of a market trend. The Average Directional Index (ADX) measures this strength, focusing on whether the trend is gaining momentum or losing it.
ADX values below 25 indicate a weak trend, while values above 25 signify a strong one. When ADX hits 50, it signifies an extremely powerful trend. Traders typically look for stocks with rising ADX levels to confirm the continuation of existing trends and capitalize on potential profit opportunities.
Moving on to "Benefits of Using the DMI Indicator"...
Benefits of Using the DMI Indicator
Using the DMI Indicator aids in identifying trend direction and measuring trend strength. This can be valuable for traders seeking to make informed decisions based on the asset's price movement.
By combining its components, such as +DI, -DI, and ADX, timely signals for buying or selling can be obtained. The indicator is also crafted to minimize inaccurate signals compared to other technical analysis tools, providing a smoother experience for traders.
Moreover, the DMI Indicator offers a simple way to assess trending markets and non-trending markets by generating indicator lines that reflect market conditions. Traders can benefit from these features when looking for more than just historical price data but also specific trading signals aligned with their strategies.
Limitations of the DMI Indicator
One consideration of the DMI indicator is that it may not perform well in non-trending markets. In such instances, the signals produced by the indicator can be less dependable. Moreover, as the DMI indicator is a lagging indicator, it may not offer timely signals for traders to enter or exit positions effectively, potentially leading to missed opportunities or delayed reactions to market changes.
These considerations are significant to take into account when utilizing the DMI indicator for trading decisions.
DMI vs. Aroon Indicator
Exploring the differences between the DMI and Aroon Indicators gives traders insights into how they can assess market trends and momentum effectively. Both tools offer unique perspectives on market direction and strength, yet they operate on different principles.
| Feature | DMI Indicator | Aroon Indicator |
|---|---|---|
| Purpose | Measures trend direction and strength. | Identifies when trends start and the strength of the trend. |
| Components | Includes +DI, -DI, and ADX. | Comprises Aroon Up and Aroon Down lines. |
| Calculation Basis | Based on moving averages of price range expansion over a given period. | Calculates the time between highs and lows over a period, represented as percentages. |
| Key Indicator | ADX indicates the strength of the trend. | Aroon Up and Down indicate trend direction and strength. |
| Usage | Effective in determining trend strength and potential reversals. | Useful for spotting new trends and reversals early. |
This comparison highlights the DMI's focus on the strength and direction of trends via its ADX component, while the Aroon indicator provides a quicker signal for trend reversals or beginnings by measuring the time taken for prices to reach new highs or lows. Both are valuable tools in a trader's arsenal, suited to different trading strategies and objectives.
Conclusion
In conclusion, the Directional Movement Index (DMI) Indicator is used to identify trends in the market. It comprises three main components: Positive Directional Indicator (+DI), Negative Directional Indicator (-DI), and Average Directional Index (ADX).
By calculating these components and interpreting their values, traders can determine the direction and strength of a trend. The DMI indicator provides valuable insights for making informed trading decisions.
Its benefits include reducing false signals and measuring trend strength accurately. However, it's important to acknowledge its limitations when using it in conjunction with other indicators for comprehensive market analysis.
FAQs
1. What is the Directional Movement Index (DMI)?
The Directional Movement Index (DMI) is a type of average directional movement index used in trading. It helps identify if a market trend is strong or weak.
2. How does DMI work?
DMI consists of two lines, positive directional movement and negative directional movement, and an ADX line that measures the strength of the trend. The DMI values are calculated by comparing current highs with previous highs and lows with previous low minus to reduce false signals.
3. Can you use DMI in non-trending markets?
Yes, combining DMI with volume indicators can be beneficial in a non-trending market as it helps identify price breaks during periods when there's no clear direction.
4. How do I interpret the DMI lines?
When the positive line crosses above the negative one, it gives a buy signal indicating upward price movement; vice versa for downward trends. The third line, ADX measures how strong these trends are regardless of their direction.
5. Are default settings good enough for using DMI?
Yes, but you may adjust them based on your needs or market conditions to get more accurate results from this tool which uses smoothed averages over a same period.